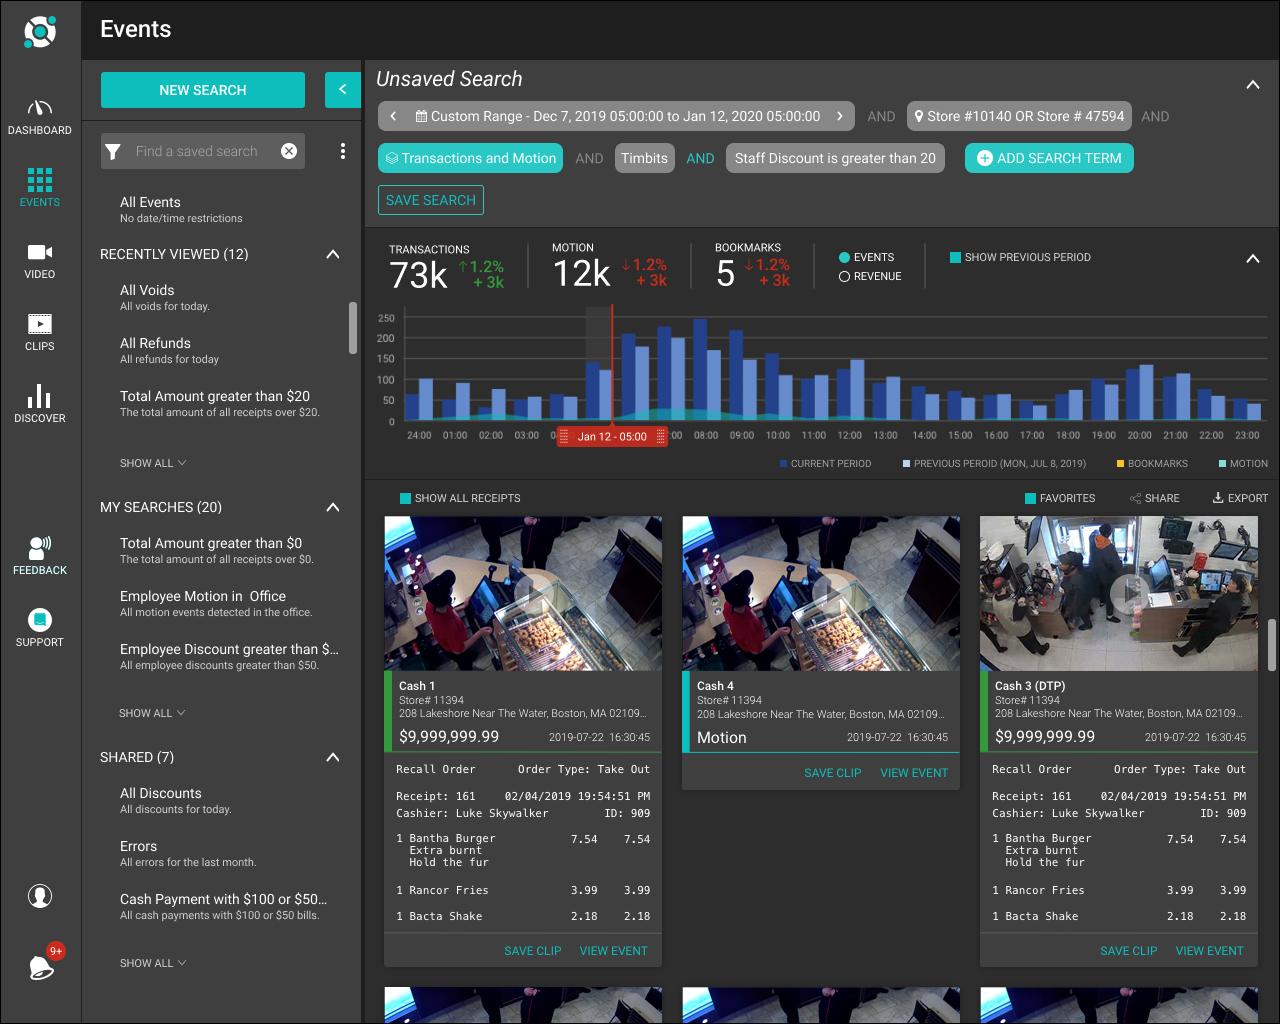
Event Search
Solink
Overview
Solink's surveillance solution pairs Point of Sale (Pos) transactions with corresponding real-time video in the cloud to create a dashboard of searchable moments. Users search these moments to find movement in a room, specific purchases and unusual employee behaviour. Solink has disrupted the video surveillance space, becoming the hub for business operations, security and loss prevention. Solink services restaurant, retail and financial sectors.
Each customer in the Solink ecosystem collects different types of video content and PoS data. Disparate data structures across customers create a search and reporting problem at scale.
For example, customer A wants to extract the number of times an employee used a staff discount to determine if the employee is abusing their discount privilege. Customer B wants to track the sale of a particular product over a month to measure the success of a marketing campaign. Customer C wants to count how often secured rooms are accessed using video motion data.
We repeatedly received feedback from customer success, sales and directly from customers that the search mechanisms were too simple and rigid. To find specific events, customers selected a report and filtered it by adding one or two search terms. Customers wanted greater freedom in searching their data to extract company insights.
Our primary focus was to improve the search experience. Our secondary goal was to ensure users could save their searches as a report.
Process
First, we identified three customers that had different business models. We chose one customer each from the restaurant, retail and financial sectors. We wanted to analyze each customer's PoS and video data to find commonalities and patterns.
We found that the data attributes with the strongest correlations were; date range, location and transaction type. We assumed that adding these three data points to the search section would immediately improve the search experience.
We created a clickable mockup based on our assumptions and approached each test customer to gather their feedback
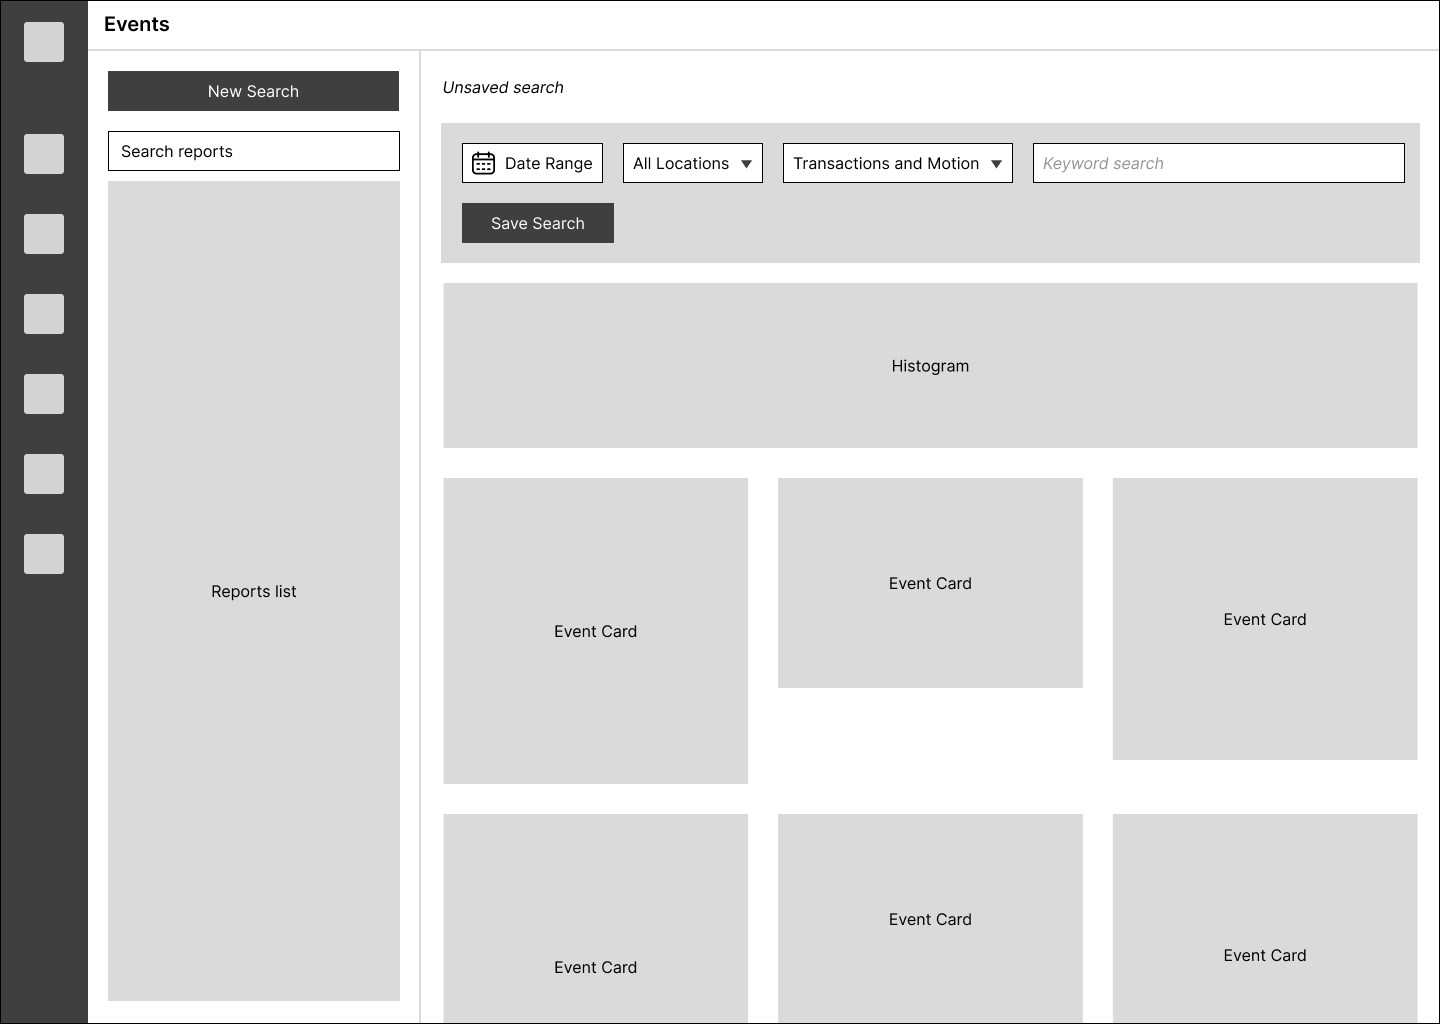
The customers loved the addition of the three inputs. It simplified and sped up the input of those values, but it fell short of the freedom customers expected from the search experience.
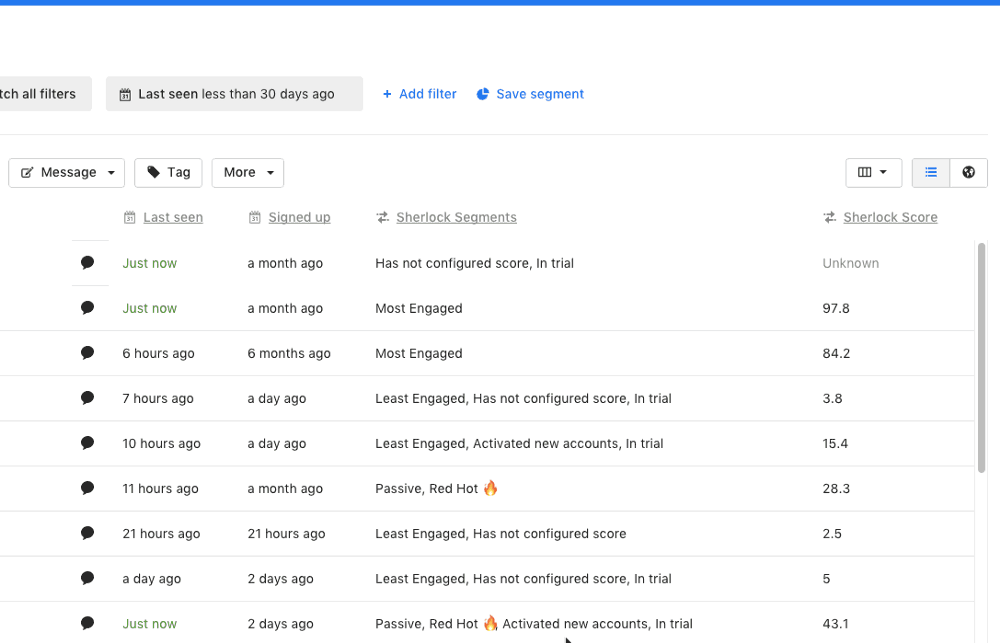
We needed to go wider with our design thinking, so we sought out examples from similar online systems that support big data at scale. We found a promising candidate while exploring the Intercom app. Intercom combines simple object-based search inputs with complicated SQL-like concepts into one experience.
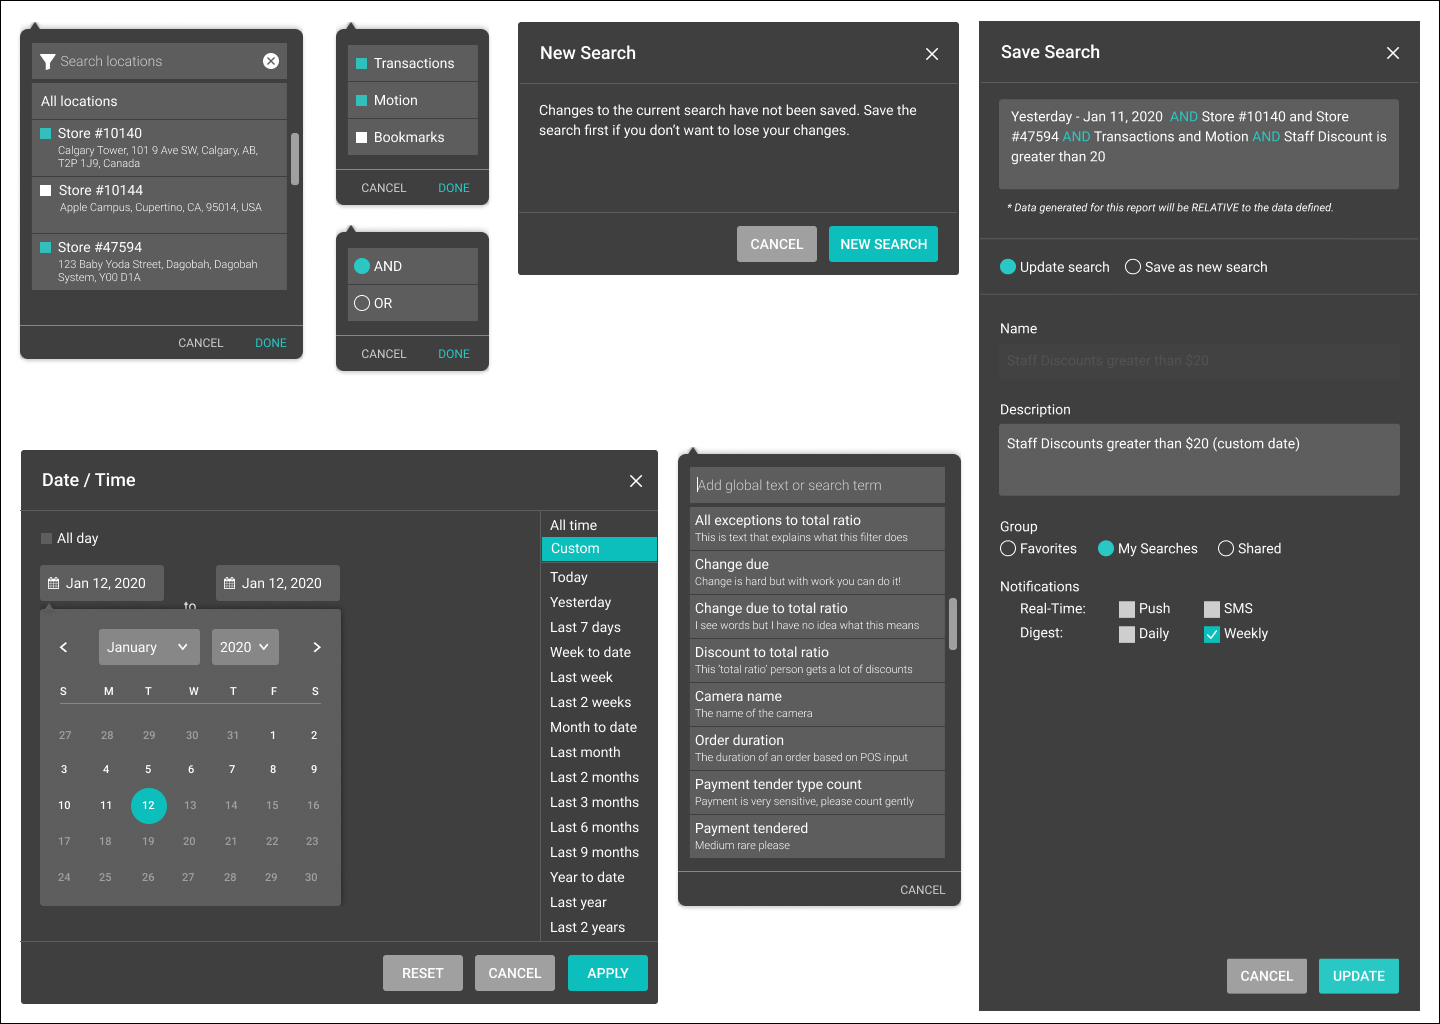
We wanted to test the Intercom pattern on our Events page, but first, we spent some time iterating a design. We did many rounds of design and feedback from engineering to ensure we did not exceed any technical constraints. At intervals, we reached out for feedback internally and from our select customers. We had to make some tweaks along the way, but there were no derailments. Finally, it was time to move to development.
Solution
While the interfaces and interactions for the final design were somewhat simple, the systems engineering to pull off the experience was technically challenging. We needed to step into the complexity of the feature over many sprints. We set up recurring touchpoints with engineering to plan sprints and bridge the gap between design and development.
We were able to start pulling metrics from the new search experience as features went live. The most striking stat was engagement. Users were spending, on average, 11% more time on the Events page. Users showed increased activity in creating reports from their custom searches and assigning them to the Dashboard. Users even included custom search results in their weekly digests.
Our customer success staff reported positive experiences as they use the Events page frequently to perform duties on behalf of our customers. Sales looped back with us to report many positive customer experiences with the improved search experience.